I turned to LinkedIn to track the size and speed at which different companies are growing. If you haven’t done it before, check out the Insights tab to figure out if a company you’re thinking of working with is big or small or growing fast or is a sinking ship. For the hot companies list, I looked at companies that are at least 50 employees and at least doubled in size over the last 2 years. Note: for simplicity, I left out OTAs, non-tech companies (like linen suppliers or business brokers), and companies that aren’t primarily focused on vacation rentals (like Avalara).
So if you’re looking for help with data and revenue management (Beyond, Key Data, AirDNA, and PriceLabs), cleaning and operations (Turno and Breezeway), or a new PMS (Hostfully and Hostaway), these are the companies that are a bit more established than our Up and Comers (see next section) but are clearly onto something as they’re growing the fastest!
Up and Comers
For the Up and Comers, we looked at companies with more than 5 employees that more than doubled in size over the last 2 years. It’s a pretty exciting list. Keep your eye on these companies as they are likely on to something if they’re growing this fast. If you’re an early adopter who likes new technology, be sure to check them out.
Company
Employees
1 Year Growth
2 Year Growth
Angel Host
41
41%
116%
Safely
39
70%
129%
Aidaptive
36
80%
1000%
Hospitable.com
35
35%
150%
Minoan
24
33%
118%
sojo
22
144%
1000%
OwnerRez
22
47%
144%
HostGPO
18
80%
500%
Better Talent
15
50%
150%
OK2Charge
15
114%
150%
Touch Stay
14
40%
100%
Uplisting
12
71%
140%
CanMonkey
10
43%
150%
Guest Ranger
8
300%
300%
Topkey
7
75%
133%
StayFI
6
50%
200%
There’s an interesting array of companies here: insurance (Safely), guest supplies and furnishings (sojo, Minoan, and HostGPO), recruiting and hiring (Better Talent), electric car charging (OK2Charge), trash can servicing – I need this for my property! (CanMonkey), guest screening (Guest Ranger), guest guidebook and messaging (Touch Stay), guest Wifi (StayFI), corporate credit card and expense management (Topkey), outsourced reservations and booking (Angel Host), and of course, property management systems (Hospitable, OwnerRez, and Uplisting).
The Old Guard
And finally, there’s the list of the old regulars. For these, I looked at companies with at least 20 employees growing less than 20% over the last year and less than 50% over the last 2 years. These are the folks holding steady. They have a good customer base but just aren’t quite growing that fast. For those in the Hot Company category, check these folks out as there’s a lot you can learn from them.
When I started In Stock, I focused on a few key problems I identified with the first time someone attempted to build a local version of Amazon. The two most prominent attempts were made around 2013 (right when I was starting Beyond Pricing): eBay Now (which was born out of the acquisition of Milo) and Google Shopping Express.
Both services sought to deliver products from local stores faster than Amazon. When I talked to former execs from both companies and asked them why it didn’t work, I identified a few key problems In Stock would need to solve:
Aggregating the inventory
Back in 2013, the inventory systems of major retailers (not to mention small independent stores) were incredibly antiquated and difficult to access. It was really hard to get access to these systems (long biz dev cycles, etc). Fast forward to 2020 and getting inventory by store was as easy as scraping the stores’ websites, almost all of which had this info readily available. For small stores, the adoption of Shopify, Square, Squarespace, Lightspeed and other eCommerce solutions similarly provided easy access to small store inventory.
Delivery costs
It was costing Google Shopping Express nearly $25 per delivery (compared to the $4 or so that Amazon charges the average Fulfillment By Amazon customer to deliver a package). There were a variety of reasons for this (narrow delivery windows of just a couple hours vs 2-day delivery for Amazon, hub-and-spoke delivery model that had Google running orders from stores to a warehouse and then back out to recipients, etc.) We needed to figure out a way to deliver for under $4 per order.
Average Order Value (AOV) and Order Frequency
We took a look at Amazon Prime users and saw that they spent a little over $40 per order and ordered twice a month on average (though subsequently we’ve seen data suggesting it’s as high as 4x per month). We needed to figure out how to get people ordering at least 2x per month with an AOV of $40 to match the stickiness and frequency of Amazon. If basket sizes were smaller or frequency lower (with similar basket size), it wouldn’t work.
Take rate
Amazon takes 10-15% from sellers on its site. Would physical retail stores be willing to give up a similar margin?
When we went through YC and talked to the brave pre-seed investors we raised money from, we focused on proving out those 4 things. If we could prove that we could quickly aggregate local inventory so that you could find everything you can find on Amazon from local stores and delivery it at under $4 same-day with a similar AOV and frequency as Amazon, all while taking at least 10% of each transaction, we could build a distributed, local version of Amazon that could deliver the same items as Amazon but faster (all while saving local retail).
So how’d we do?
Aggregating the inventory
We quickly were able to get to inventory parity with Instacart (for non-grocery stores) and close to parity with Google Shopping by aggregating big box inventory from Target, Best Buy, Home Depot, Ace Hardware, DICK’s Sporting Goods, Walgreens, CVS, Office Depot, Bed Bath & Beyond, Petsmart, Macy’s, JOANN’s, and Guitar Center, with many others in the pipeline. We were adding 1-2 new nationwide big box stores every week spanning over 45,000 individual locations (that’s more than Instacart). Beyond that, we built a way to aggregate inventory of small, local stores and added 100s of those with a path to quickly adding 1,000s more. 90% of the time you searched for a product on In Stock, you’d find it at a local store. We thought that was pretty cool and impressive.
Delivery costs
We ran our first pilot in our hometown of Santa Cruz (a lovely beach town just over the hill from San Jose). The County is about 300,000 people which was a good test for whether we could make this work in tertiary markets. Within 3 weeks, we were getting 20 orders per day. Most importantly, we were able to deliver at least 5 orders (including pickups from stores) in an hour. At $20/hr pay for drivers, that got us under $4 per delivery. Here’s a great example route if you’re curious: https://www.linkedin.com/posts/ianmchenry_how-does-in-stock-get-delivery-down-below-activity-6760364374508081152-mOb-
It was clear that we could drastically increase density with more demand and probably drive delivery costs down to below $2. This was the most shocking finding for us and what we were most excited about.
AOV and Frequency
Without really trying to drive up basket size by nudging people to add-on items, we organically came out to around $40 per order. Of course, this ranged from $10 orders to couple hundred dollar orders, but it all averages out to almost exactly what Amazon sees. Frequency was around 2x per month until we launched our Concierge service, which allowed you to text us any link from Amazon and we’d find it locally and deliver it to you same-day. For our small group of test users, we saw 6x per month order frequency as they effectively moved all of their Amazon purchases over to In Stock.
Take rate
Rather than create upfront friction by asking for a 10% take rate from stores, we basically hacked our way to getting at least 10% off the retail price from most merchants through a combination of coupon codes and credit cards. For instance, Target and many others have cards that give you 5% back. Bed Bath and Beyond gives you 20% if you sign-up for their Beyond+ program. Local stores consistently have 10-20% off codes. The idea was that we’d get our margin there and eventually, when we were bigger, work out a formal deal and go to the stores and say, hey, we’re already getting 10% off through these codes; why don’t we formalize this?
So Why Didn’t In Stock Work?
At first glance, we had achieved the impossible. We’d something that worked and that was, as one customer put it, faster than Amazon and cheaper than Instacart (turns out people hate those not-so-sneaky 15% markups on their items). And the unit economics worked, most importantly!
We failed because we didn’t focus on THE key driver for a consumer company: how to be 10x better.
We were better but not 10x better. Another YC company that recently raised a big round after going through a pivot, Airbyte, recently summed this up pretty well. We had built what we thought was a “better mousetrap” but you actually don’t want to build a better mousetrap. As they put it, building better marketing automation software sounds like a great idea (huge market, current products have things people hate about them, etc.) but in reality you’re stuck fighting against a much bigger, better-financed rival who already has the mind-share and the money to maintain the mind-share. For all its faults, people still use Marketo and Hubspot and building a better version of the same thing is not how you’ll win.
What really drove the point home for us was watching our super-engaged Concierge users slowly reduce the frequency with which they used us, going from 6x per month to 2x per month to barely monthly in the course of a few months.
When we dug in, we realized that 10% of the time, we couldn’t find them a suitable local alternative to the item they found on Amazon.
This might sound like not a big deal (90% of the time we found the same or a similar item available locally for the same price that could be delivered faster! What a win!) but the reality is that the cognitive effort of then having to go back to Amazon to get the item built up.
We weren’t the everything store so what were we?
The pain of not being able to find what you want 10% of the time turned out to outweigh the benefit of getting the item (slightly) faster.
This last part was really the nail in the coffin. Most items on Amazon are going to get to you in 24-48 hrs. More and more it’s less than 24 hours (like the box of Crayola markers I ordered for my kids at 6pm and arrived before I got home at 4pm the next day).
Two things were at play:
Some items you want soon but you don’t need in 30 minutes so the marginal benefit of getting them faster is less than the pain of searching for them on another app;
The difference between 6-12 hours (like In Stock was doing…though sometimes it was as few as 3 hours) and 18-24 hours is again very marginal.
So in the end, we focused on all the right things except one: building a 10x better experience.
I still am not sure what that experience looks like but my guess is DoorDash or Instacart will power it. We’ll see.
What’s Next?
I swear half of the reason I started a new company a few months after stepping away from my first company was because everyone kept asking me “what’s next?” Right now, nothing is next. Every time I have an idea for something I wish I existed, I look for people smarter than me or with more domain knowledge than I have who are already building it and try to angel invest in them. But I am really struggling with the psychology of having had a successful first company and a failure of a second company. If you’re a founder who’s had a similar experience, I’d love to chat. Justin Khan’s videos and thoughts on the hedonic treadmill have been incredibly helpful. When you build a $100m company, you feel like you need to build a $1bn next. You feel like you have the golden touch and that all your success was because of your special, unique talents and insights. And when you don’t, you realize how much success is luck and timing. It’s very humbling. But it’s an important worldview shift that helps you have more compassion. Much of our success is a product of our luck, whether it’s being born in a certain country, born as a certain race or gender, born into a certain socieconomic status, or just having a lucky or chance encounter that changes our fortunes.
Which is a long way of saying, this time, nothing is next.
Appendix: Some Learnings for DoorDash and Instacart (or anyone else)
DoorDash and Instacart are the best positioned to take on Amazon and help local retail compete. The reason is simple: they have the WAU (weekly active users).
Whether restaurant delivery or groceries, both of these are weekly habits that have created a loyal customer base for each. They don’t actually have to create a 10x better experience in other categories. Simply by adding local stores to their menu of items you can order, they can sell more things down the same channel.
Both of them have started to do this, but obviously have a long way to go. Not that they asked, but here are the things that they (and local retail) need to get right to compete with Amazon.
Out of Stock Rates
A friend told me Instacart has to make a substitution for 12% of items. Think about if when you clicked buy on Amazon, 1 out of 8 times they told you hours later that they’re so sorry, they don’t actually have that item in stock. That has never once happened to me on Amazon. Physical retail stores need to improve how they keep items in stock, which is actually a pretty complicated problem. There are lots of startups attacking this (ShelfEngine, Jyve and others) but it’s far from a solved problem.
We had developed a pretty great work-around that was made possible by knowing every place around that had the same item. We’d simply do a hot switch and if we got a notice that Target was out of, say, Bounty Paper Towels Select-a-Size, we could automatically place an order with the local Walgreens. By running a milk-run route with multiple stores, you can do this while you can’t if you’re just shopping one store like Instacart currently does.
That being said, physical retail stores need to understand that people are already enduring additional pain to try to shop local and when they actually think to order something locally and then find out it’s actually not available when you said it was, it drives them back to Amazon where that doesn’t happen.
Order turnaround time
The time from when you place an order to when it’s available for curbside pickup varies greatly between store brands (and individual locations). Some Target stores can take up to 4 hours. Others turn it around in 20 minutes. Some stores only check for new orders every 4 hours. Ace Hardware, which is franchised, is probably the least consistent. Stores need to: a) Have a clear process for alerting associates to a new order and scheduling the picking of that order; b) Have a clear standard for fulfillment times and track and improve that.
2 hours is probably a good starting point but eventually stores will need to move to 30 minutes or less (like Walgreens has). If they are going to work with DoorDash or Postmates or Instacart or any delivery service, this is essential.
Driver Pickup Time
This needs to be sub-2 minutes. A driver’s time cost at least $0.33 per minute. In order to match Amazon’s delivery cost, every minute counts. Every 3 minutes it takes, costs another $1. If a service is only making 10% on a $40 order ($4 commission) plus $4 delivery, then any excess time eats into that $4 commission.
This is probably the most variable experience you’ll see out there for a number of reasons.
Time to lookup orders when customer arrives + details required to pickup an order
Some stores allow you to just click a button when you arrive (like Target or Walgreens) that sends the order info to the associate to make it easy. Others (like Ace) ask you what name it’s under or what the items are. Ideally, someone can simply click an order-specific link (since requiring delivery drivers to have the Target app downloaded isn’t reasonable) and that notifies the associate to bring out the item. Home Depot does a great job of this.
One major issue where stores need to mirror how DoorDash works is the requiring of ID to pick up an order. Some other form of verification like an order number is all that should be required. It’s a stretch to think you’re going to have massive fraud from people somehow stealing order numbers and claiming pickups. Speaking of which, don’t just make every new order 1 higher than the previous order and you should be fine. We’ve seen stores selectively ask for ID from minority drivers (Target being the worst example but it wasn’t just them). Just ditch the ID requirement and stick to unique URLs and order IDs. This is particularly important when working with delivery companies because they don’t always know until after the order is placed who will be picking it up.
Time to locate already picked orders
Some stores have them sitting right there in the front and a devoted person ready to bring it out to you right away. Others have them stored in the back and it can take them 5 minutes just to locate the items. Stores need to have items right in front of the associates responsible for getting those items out to customers.
Time to bring orders out to the driver
In general, stores need to set metrics for associates to hit. Just like someone checking you out at a grocery store has items per minute metrics (or at least my wife did when she worked at Whole Foods 20 years ago), associates need an incentive to hustle and optimize the speed at which they get orders out to customers. Part of this is the speed of individuals and some of this is the design of the pickup process.
For instance, at Home Depot, they have an associate sitting in the parking lot. They get a notification that someone has arrived to pick up their order. They walk slowly back into the store to find the item and then come back out with it. Even if 3 orders came in and there are 3 people waiting there, I’ve seen them just go back and forth one by one each time.
4) Product Assortment
Ultimately, this is what I got wrong. I thought having 90% of what people were looking for was good enough. Turns out, being a one-stop shop is incredibly powerful. If people have to think “What do I go to In Stock/DoorDash/Instacart for?” because they don’t have everything, they ultimately won’t bother and will just go to Amazon for anything besides restaurant food or grocery delivery.
Curious what kinds of things are tough to find locally? Here are some examples of items that we couldn’t find locally:
Desk Mount for a Camera (Best Buy and office supply stores often have one option. One huge advantage Amazon has is that there is every possible iteration of a given product. For this, they had every possible kind of mount and bracket and height, etc)
Cycling Sunglasses (the local bike shop had some but they were 4x the price)
Desk Mount for Laptop (Best Buy and others only have the type that sit on a desk, not that mount to it)
Anker 4-Port USB 3.0 Hub, Ultra-Slim Data USB Hub with 2 ft Extended Cable (again, there were ones with short cables and much larger available from Best Buy locally but nothing like this. You could probably sacrifice some features if you were in a pinch, but why would you when Amazon can deliver the exact thing you want in a day or two)
MZOO Sleep Mask (the top result when you search “sleep mask” on Amazon; like many top results it’s an internet-only brand that has just iterated on the design so quickly that no stores carry anything like it. They all have sleep masks, but not 3-D contoured like this one)
Desk organizer (other places had desk organizers, but none that had a drawer combined with a hanging folder section in the back. Again, Amazon has every possible iteration of a desk organizer so you don’t have to sacrifice anything)
Again, 9 out of 10 times, what people were looking for was available locally. But it’s that 10th item that sends them back to Amazon and it’s just easier to stay on Amazon and always get what you’re looking for, even if it takes 12 more hours to arrive.
As you start to truly scale your software startup, you’ll probably start to hear investors talk about the Rule of 40.
Simply put, you take you growth rate and subtract your EBITDA margin. If it’s above 40%, you’re in good shape. If it’s below 40%, you should start figuring out how to cut costs.
For example, if you’re at $5m in revenue and growing 100% (expecting to hit $10m in revenue next year) but losing $6m in the process (negative 60% EBITDA margin), you’re okay. Lose any more than that, and you’ve got to dial back on spending. Here’s a recent post with some great charts looking at how public SaaS companies conform to the Rule of 40 from the smart folks at Volition Capital: https://www.volitioncapital.com/news/the-rule-of-40-growth-profitability-and-the-tortoise-and-the-hare/
The Rule of 40 is wrong for fast growing companies
My guess is the Rule of 40 comes from the fact that a mature software company should expect 20% EBITDA margins and likely will be growing 10% (which would equal 30% combined number for the Rule of 40), and because investors always want to push you, that becomes 40.
However, as long as you are burning money to drive growth, the Rule of Negative 40 is a much better metric.
Here’s why:
For every dollar of additional revenue, you are adding, at a minimum, 6x that in additional company enterprise value, given the low end of SaaS valuations. If you go from $10m in revenue to $20m in revenue, your valuation, theoretically, goes up from $60m to $120m. You should be willing to spend up to $60m to add that $10m in revenue. With the Rule of Negative 40, you’d be willing to have a -140% EBITDA margin to support 100% growth, or in this case, burn $14m. That’s still over a 3x return on the $14m investment ($60m gain in value for $14m of spend).
There’s one caveat:
The rest of your P&L needs to be at the right ratios.
If you’re overspending on G&A (office space, free lunch, HR, execs, etc) or your gross margin isn’t 75-80% or anything else is structurally unsound, the theory goes out the door because you aren’t able to cut your way to 20% EBITDA margins if you wanted to stop growth but improve margin.
I’ve put together a quick spreadsheet to demonstrate this, if you want to make a copy and play around: https://docs.google.com/spreadsheets/d/12gI2cmF899Pa1l0J4hZh867aVsNGMPRJ7IBG4xa7SbM/edit?usp=sharing
Note, there are obviously plenty of other factors that play into why you might want to be more conservative with your burn relative to your growth, including, most importantly, your ability to raise the capital needed to fund that growth.
Would love to hear your thoughts on the new Rule of Negative 40!
I remember in the early days of Beyond Pricing, I always hated when a VC would focus on how we could become a unicorn.
We had a great idea, the market needed it, and we were growing! Heck, we probably had product market fit! Why wouldn’t you invest us!
Turns out, there’s some pretty basic math behind why a venture capitalist needs to hear a plausible story about how, in ten year’s time, your company could be worth $1 billion.
Venture Capital is an Asset Class
The first thing to recognize is that a venture capital fund, to those who invest in it (LPs), is just one of many other funds or other places to invest. These LPs can be university endowments, family offices, wealthy individuals. But they are all measuring the venture fund based on its returns compared to other places they could put their money. A very common benchmark is what you could make by just putting your money in an S&P 500 index fund. While that varies from year-to-year, the long-term averages is around 8% annual return.
So if you’re going to invest in a venture fund, which is inherently more risky than the S&P, you’re going to hope to get a decent premium to that 8%. By most standards, a decent VC annual return is 10% after fees, or 12% before the standard 2% annual fee VCs charge LPs. Moreover, the average fund will last 10 years. A little bit of simple math shows that the total amount of cash returned to the investors after 10 years needs to be over 3x the invested capital to hit that annual return target (1.12^10=3.1x). So a $100m fund needs to return $300m to make its investors a small premium over the S&P to account for A LOT more risk.
There’s been a lot written about VC math here and here but you can see both in the examples in those posts and in this spreadsheet which you can download and play around with, there’s almost no reasonable way to get to 3x without at least one $1 billion company in your portfolio as a seed investor. And if a fund can’t get to 3x, the investors were likely better putting their money in the S&P.
(Note: all of these analyses are oversimplified back of the envelopes and don’t model out the full impact of dilution and many other things that move the needle slightly one way or another)
With a fund with 20 companies (which is fairly typical), you would need two companies to sell for $300m, three for $100m, and four for $50m (along with some smaller exists or returns of capital, though that doesn’t affect the outcome much). Nearly 50% of your portfolio would need to sell for $50m or more. The actual average is closer to 10%.
A more likely (and still unlikely given the low percentage of VC funds that actually hit a 3x return) scenario if you’re lucky is to have a single unicorn, one that sells for $100m, and two that sell for $50m. In that scenario, over 75% of your returns are from the unicorn (which matches the general power law in venture capital)
So How Do You Show You Could Be Worth $1 Billion?
This is where TAM (total addressable market) comes in and why it matters. Basically, you’re trying to show, if everyone bought your product, how much revenue would that be. Then make some sort of assumption about what a reasonable market share would be (reasonable being the operative word; you should know what market share the most successful company in your space has and don’t assume anything more than that or risk losing credibility).
For instance, for Beyond Pricing we showed that globally, vacation rentals do about $180 billion annual in revenue. We charged 1% of revenue for our product. So our addressable (for our first product) was $1.8 billion. Given our first-move advantage, the tendency for vertical software products to achieve much higher market share than horizontal products, and the lack of well-funded competitors, we thought 10% market share was (justifiably) reasonable (and probably low). That would come out to a path to $180m in annual revenue.
You basically need to answer the question the VC has around what they need to believe for you to get to a certain amount of revenue. If they believe that’s doable, you’re in business!
The final question is, what amount of revenue equals a billion dollar company. I’ve written a bit about that before, but the key is knowing what the typical price-to-sales ratio is for your industry. In software, depending on your growth rate, that’s typically 6-10x revenue. If you’re building a venture-backed, billion dollar company, you’re probably growing on the fast end, so a 10x revenue multiple is reasonable, meaning you need to show a believable path to $100m in revenue.
That’s the magic number you’ll often hear a VC ask you.
What if there’s not a clear path to $100m in revenue?
If you can’t show that path, you probably have a really nice business but shouldn’t take on venture capital. There’s plenty of other ways to fund your business, but, as you can see from the math, venture capital just doesn’t make sense.
As I was building Beyond Pricing, very early on we wanted to focus on building a company based on the right ratios.
One of the best ratios I came across was the revenue per employee.
This is a great measure of how efficient you are. Both Tom Tunguz and Jason Lemkin have written great posts about this.
The main takeaway is you should target $200k revenue per employee.
Fast growing companies who are burning capital might dip down to $100k revenue per employee, but anything below that is likely not going anywhere fast and will soon run out of money.
So how do you estimate a software company’s revenue? Multiply employees by $100-200k.
Typically, the more mature the company, the closer to $200k they will be. This isn’t always the case (we definitely bucked that trend at Beyond Pricing).
Let’s look at a couple examples, using LinkedIn.
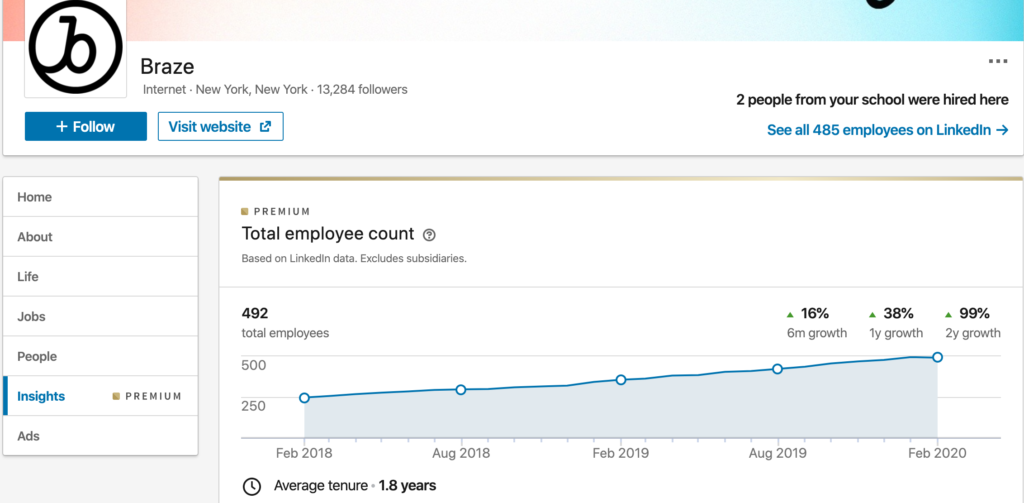
Braze has around 500 employees. They’ve been around a while, so are likely closer to $200k per employee, which would mean $100m ARR.
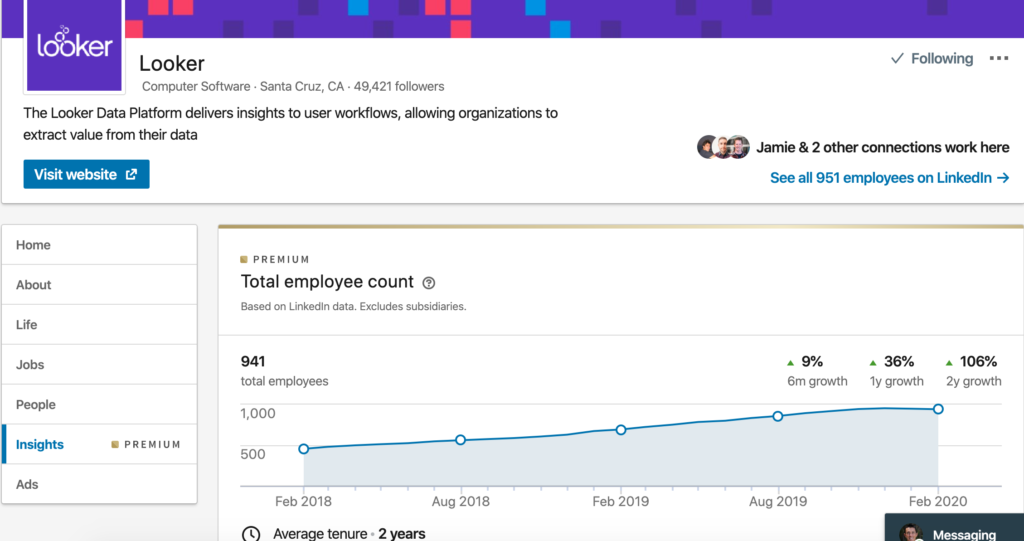
Looker as around 900 employees. We’d expect them to have around $180m ARR if they were at $200k revenue per employee.
About a year ago, based on employee growth rates, they had around 650 employees. Back then, they claimed to have $100m ARR. That puts them right around $150k revenue per employee, right in the middle of our range. If we use that number to update our estimate, they’d be at $135m ARR, right around the $140m Cowen estimates.
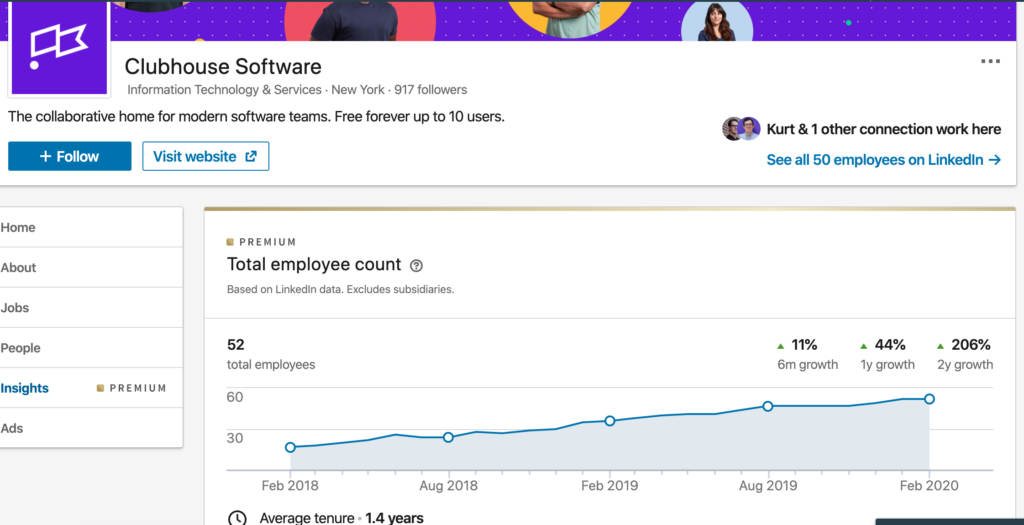
One final example with a disclosure that I know the founders but don’t actually know their revenue. Clubhouse recently raised a Series B and has around 50 employees. I’m going to guess their ARR is right around $5m.
This is further supported by a couple posts about average ARR for different rounds (here and here). tldr; Series A: $1-2m, Series B: ~$5m. I’ll let Kurt and team confirm or deny 🙂
As far as growth, in general, I’ve found revenue growth to typical be 50-100% higher than the employee growth shown on LinkedIn. For instance, looker had employee growth of around 40% according to Linkedin from 2018-2019 but they reported 70% ARR growth. This more or less matches what I saw at Beyond Pricing as well.
By the way, this is often what analysts at venture capital and private equity firms are looking at. So don’t be surprised when your employee growth rate is above 50% (meaning you’re likely 2x-ing or more) and your employee count is approaching 50 to get those calls from Series B investors. I know we did!
A final note: this is only for US-based software companies. They don’t really apply in other countries where labor is much cheaper or other industries, where average wages are much lower.
As I’ve been doing more and more angel investing, I’ve started to dust off my valuation chops from my investment banking days.
One common difficulty is valuing a company that currently is not profitable.
If we assume a company is growing revenue at the same rate as the overall S&P 500 (5% or less), they should expect a P/E (price to earnings) ratio of 15-20x.
While the historical average has been closer to 15x, the last 3 decades have sustained a 20x or so multiple.
So how do you figure out what the revenue multiple should be?
The easiest way is by figuring out what the average profit margin is. For software companies, this is typically around 20%.
Revenue multiple = P/E multiple X profit margin
For instance, for software companies:
20x * 20% = 4x revenue multiple.
The key to understanding revenue multiples is understanding that different types of businesses have different abilities to produce earnings. Some, like software, are high-margin (20%+ net income margin) while others are low margin (e.g. retail at 5%). A high margin business commands a higher revenue multiple because more of that revenue will turn into earnings. For instance, both Oracle and Target have about a 20x P/E multiple. Target, however, trades at a 0.8x revenue multiple because its net income margin is only about 4%. Oracle, on the other hand, has a 24% net income margin (6x that of Target) and trades at a 4.8x revenue multiple (6x that of Target). Funny how that all works.
If you take a 20x P/E multiple (though Samsonite’s is closer to 15x), they imputed revenue multiple based on 8% profit margin is 1.2x revenue.
Away reported that they expect to double the $150m of revenue they had in 2018 for 2019, putting them at $300m. Based on the revenue multiple above, they would be worth about $360m, if they immediately stopped growing.
In another post, I’ll talk about the “growth multiple” and how it relates to future cash flows. This will explain why paying 4x for a fast growing company isn’t crazy. In fact, it’s often a steal.
As a final note, if a startup can show how they realistically can have outsized margins at scale versus the traditional public comp, that will drive a higher revenue multiple as a function of a higher future expected profit margin. While many startups claim to be able to do this (direct to consumer, new way of manufacturing, etc), this rarely is the case. See Casper’s recent filing as a great example.
With Sonder and a long-tail of others raising large amounts of money for “tech-enabled” hospitality, many in vacation rentals and venture capital are wondering whether these businesses deserve the kind of valuations they are receiving.
This will be part of a larger series of posts about valuation of startups in general.
A quick primer on how companies are valued.
Companies exist to produce cash flows (eventually) and at the end of the day, are valued on how much cash flow can be expected in the future. Whether using a DCF (discounted cash flow) analysis or a P/E ratio (price-to-earnings) or EBITDA multiple, a company is worth the free cash flow it will produce for its owners or shareholders.
Sometimes this will go up, either due to market exuberance or stronger than average growth rates, because higher than average growth rates mean that future cash flows will be great than normal and thus the ratio of price to current earnings goes up to account for those higher future earnings.
Earnings and growth can explain the majority of valuations (faster growing companies like Okta or Zoom command a greater P/E multiple than slower growing companies like Oracle).
However, when a company doesn’t have any earnings (like most startups), how can you value it?
One way is a revenue multiple.
The key to understanding revenue multiples is understanding that different types of businesses have different abilities to produce earnings. Some, like software, are high-margin (20%+ net income margin) while others are low margin (e.g. retail at 5%). A high margin business commands a higher revenue multiple because more of that revenue will turn into earnings. For instance, both Oracle and Target have about a 20x P/E multiple. Target, however, trades at a 0.8x revenue multiple because its net income margin is only about 4%. Oracle, on the other hand, has a 24% net income margin (6x that of Target) and trades at a 4.8x revenue multiple (6x that of Target). Funny how that all works.
One last note on valuation. Growth matters. Oracle has flat growth. Others like Zoom and Okta have much faster growth and trade at much higher P/E multiples (perhaps too high…). I’ll dive into how much growth matters to revenue multiples in a future post.
So how do we value a vacation rental property management company?
Because there are no Marriotts or Hilton’s of vacation rentals (and because the business model is still quite different), there are few publicly-traded comps to guide us toward what the relationship between earnings potential and net income margin are. However, there is one great comp that gives us some insight: Sykes Cottages. The company recently sold to Vitruvian Partners for $480m (source: https://skift.com/2019/10/29/sykes-cottages-sold-for-480-million-in-a-bet-on-tech-led-short-term-rentals/).
They disclosed they have around $87 million in revenue, $25 million in EBITDA, and 18,000 homes in the last 9 months. If we annualize that, it’s $116m in revenue and $33m in EBITDA. Without knowing their tax and interest exposure but guessing it’s minimal, their P/E ratio is about 15x. That’s pretty good! Much better than the 3.5-5.5x that smaller management companies can expect (source: https://www.vrmintel.com/what-is-my-company-worth-a-back-of-the-napkin-analysis/). However, their EBITDA margin is a fantastic 28%! That’s Oracle-level and much greater than most real estate asset managers in the US that are publicly traded.
I would assume this is best in class. As such, their 4x revenue multiple is a good high water mark.
One important thing to note is that Sykes is a traditional manager, so its revenue number is presumably the commission they make, not the total bookings they manage. This is supported by the fact that their revenue per property is around $6,400/year which is about 25% of the $25,000 per year of rental income you’d expect from their highly seasonal markets. (I’ll let Graham correct any of these assumptions, of course!)
I note this because the revenue numbers reported by folks like Sonder are total bookings numbers because they use master leases and so get 100% of booking revenue, not 20%.
So if revenues aren’t apples-to-apples and there is no profit, what else can we use?
One common metric is price per property managed. For Sykes, this came out to around $28,000. Another recent comp was Vacasa’s purchase of Wyndham’s vacation rental unit. While revenues weren’t disclosed, we know it sold for $162m and had 9,000 properties, which comes out to $18,000 per property (source: https://www.vacasa.com/news/vacasa-finalizes-purchase-wyndham-vacation-rentals)
Assuming they could achieve the same profitability that Sykes does and get the same value per property, they’d be valued at around $240m. However, Sonder has grown 4x in the last year while Sykes took 4 years to quadruple in size. Basically, Sonder will have grown into that valuation within a year, which sounds actually quite reasonable.
In a future post, I’ll outline how much of an impact growth has on valuation and why investors pay a serious premium for fast growing companies.
One final thought to bring it back to apples-to-apples comparisons of revenue and how we can compare revenues from traditional management-fee based companies to the new master lease model. Sykes, if we assume they charge a 25% commission on average, has a profit equal to about 7% of booking revenue (25% commission * 28% EBITDA margin). Sonder reported they will have $400m of booking revenue this year. If they were able to achieve the same profitability as Sykes, that would be $28m of profit, which, at the 15x P/E ratio we discussed earlier, gets us to a valuation of $420m, based on current revenue and properties. The reason for the much higher number? The revenue per property that Sonder appears to be claiming is closer to $50k vs $25k which we assumed for Sykes.
As a bit of a sanity check, I had a chat with my friends over at C2G Advisors, who see a greater number of deals than anyone, most likely. Just as the 20x EBITDA for Sykes and larger companies is much greater than the typical 3.5-5.5x they see for smaller, 50-200 property companies, so, too is the valuation per property.
(As a side note, this is common through company valuations. SMBs are valued at a much lower multiple than larger companies because there is more risk and an SMB is more fragile than a very large corporation. This is part of the reason why larger companies like Vacasa and Sykes can unlock a lot of value by buying smaller companies. If they buy at 5.5x EBITDA but get valued at 15x EBITDA, the deal is instantly accretive even without improving profits.)
Depending on the location and annual bookings for a property, typical ranges they see are $5k-$15k. One key insight from Jim and Jacobie at C2G is that the great equalizer between managers in all markets is the % of booking revenue they capture. When you combine that with their EBITDA margin, you can actually get to EBITDA as a % of booking revenue, which is a great equalizer across traditional managers but also the Sonder-types. In an example they said was typical, a manager might capture 37% of booking revenue as “their” revenue and from there, achieve an 18% EBITDA margin. If you do the math, that comes to an EBITDA margin of 6.5% of booking revenue. That’s pretty darn close to what Sykes seemed to be showing!
As an additional caveat, traditional property managers in the vacation rental space earn revenue not just from commission (a % of booking revenue, typically around 20-25%) but also from fees and other ancillary products they sell where they keep 100% of the revenue. This can amount to 12.5-25% of the booking revenue. This type of “ancillary” revenue is becoming increasingly important, following a trend I saw in airlines decades ago as ancillary become upwards of 30% of revenue at places like Ryanair. In addition, some of the best performing managers will see EBITDA margins from 20% to as high as 30%, which would bring their EBITDA as a percent of booking revenue to upwards of 10% in some cases.
One last fun bit of math. If a property does $30k in annual bookings, you would expect it to do around $2k of EBITDA (based on 6.5%). Stick a 3.5x EBITDA multiple and that gets you $7k per property, right in the range C2G mentioned above. Funny how that works.
The caveat to all of this is the question about whether “tech-enabled” property managers who are now primarily taking out master leases on properties can achieve that level of profitability. While comparisons to WeWork rattle the investor community, if you look at a WeWork competitor, Regus, which has been around much longer, they have a 4% net income margin, which while less than the 7% of booking revenue we see from Sykes is still in the ballpark (source: http://investors.iwgplc.com/key-financials/income-statement).
In summary, for a fast-growing tech-enabled vacation rental manager, it’s reasonable to be worth 1.0-1.5x booking revenue or close to $30k per property. And for those growing 4x per year, it’s not a crazy leap to get to 2.5x of booking revenue.
Square recently raised another $150M from investors at a $6B valuation. Talk about this valuation being outrageous and Square running out of cash and being the first of many tech companies to fold in the coming tech bubble apocalypse has been floating throughout the blogosphere.
But before we start hoarding our money in gold and Bitcoin, let’s take a look at other comparable public companies in the payment technology and payment processing industry.
Payment processing is a complex ecosystem with merchant acquirers, payment processors, payment networks, and all kinds of steps between the merchant and the bank that issues the credit card.
If we just look at the largest merchant acquirers, the field is dominated by large financial institutions like Chase, Bank of America, Wells Fargo, and Citi. The biggest non-bank is First Data but they are owned by private equity firm KKR, who knows a cash cow when they see one.
As for public companies, the largest are Vantiv, Global Payments, and Heartland Payments. These are companies that have been around much, much longer than Square.
It’s been estimated that Square processes $30B-$40B in transactions. For comparison, here is the approximate transaction volume and market cap for the public comps:
Vantiv (NYSE: VNTV): $600B / $6B
Global Payments (NYSE: GPN): $200B / $5B
Heartland Payment Systems (NYSE: HPY): $100B / $2B
Obviously, a lot more goes into a valuation than simply the volume of transactions processed, but it’s a decent proxy for understanding whether Square’s valuation is sensible.
Looking at the comps, the valuation / transaction volume ratio ranges from 0.01 to 0.025. For Square, this would equate to a valuation range of $300M-$1B.
But as any investor knows, you pay a lot more for a fast growing company than for a slow growth company. Most of these public companies are growing at annual rates of 5-10%. Reports suggest that Square is growing at 50-100% YoY.
If Square continues to grow at 50% YoY from a base of $30B in transaction volume, it will surpass the $200B annual volume that Global Payments has in 5 short years. That’s a lot faster than it took them.
One other data point. Vantiv recently bought Mercury Payment Systems from private equity company Silver Lake Partners for $1.65B. Mercury processed $30B per year in transactions, the same as Square. It took Mercury 13 years to reach that point and Square has done it in 5. The valuation / transaction volume ratio for Mercury, which is much more similar to Square than the other public comps, since both companies were payments technology companies instead of the actual processors, is 0.055. At current growth rates, Square will match that ratio in 3 short years.
Time will tell, but investors may be kicking themselves in 3 years for not having the foresight to invest at such a low valuation.